

Trend indikators
Moving Averages (Moving Average, or
removals).
The idea of an indicator lies in the
fact that random fluctuations in the price is hampered understand
where the market is moving. Therefore, the formula for calculating
the indicator suggests smoothing of these oscillations.
Simple Moving Average (Simple Moving
Average - SMA):
SMA = (P1 + P2 + P3 +??.+ Pn) / n
P = Price - regular price. Typically, the price calculation using
the closing price (Close).
n - the period (the window, order, length) moving average. This is
the number of bars on which the indicator is calculated.
The main drawback of SMA is that it responds to a single change
course twice: when getting the value and at its disposal from the
calculation. Therefore, we can use more advanced options display.
Weighted averages (Weighted Moving
Average - WMA):
WMA = (w1 * P1 + w2 * P2 + w3 * P3
+??.+ wn * Pn) / (w1 + w2 + w3 +?? + Wn)
wi - the so-called "weight" or simply, the coefficient, which is
assigned to each price. The closer the price to date, the higher the
ratio is assigned a price.
Exponential moving average
(Exponentially Moving Average - EMA):
EMA (t) = EMA (t - 1) + (K x [Price (t)
- EMA (t - 1)]
where t - current time (current bar)
t - 1 - previous time (the previous bar)
K = 2 / (n + 1)
n - period average.
The main advantage of EMA is that it
includes all the prices of the previous period, and not just the
segment specified in the installation period. In this case, the
later values will have greater weight.
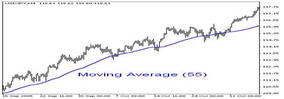
Length Movings correct to select a specific tool in which you trade,
and a specific scale of the graph.
Some traders believe that it is best to use the numbers from the
Fibonacci series.
For example, the following values.
Recommended order of the average
Order of the average price chart
5-day 8, 13, 21
1-day 8, 13, 21, 55, 89
4-hour 8, 34, 55, 89
1-hour 8, 34, 55, 89
<15 min. 34, 55, 144
Using the indicator:
Point of intersection of Moving Average and the price chart is used as signals of the position opening in the direction of the trend. Inverse intersection are used as signals for closing the position.
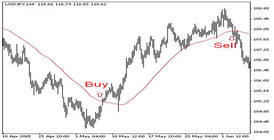
In the first method is often a false signals, since markets are becoming every year more and more mobile. Therefore, as a signal using the intersection point of two Moving Average of different lengths (n1 and n2);
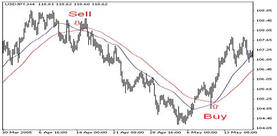
Moving Average of great length can themselves be pointers trend. For values of indicators over 40, they have little reaction to the wave motion graphics and indicate only the general direction of movement (trend);
The point of greatest divergence of average and
the price chart indicates that the market is strongly "overheated
and a correction.
Moving averages work well in trending markets, and very bad at
without trending
(flat), since the delay of moving averages will produce false
alarms.
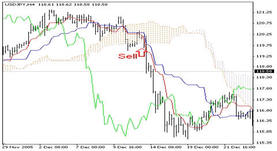
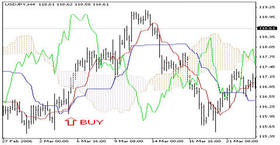
Alligator (alligator)
Based on moving averages Bill Williams (full
exposition of the theory of Williams, see Williams' Chaos Theory)
proposed by this indicator, which consists of three lines:
The blue line (Alligator's Jaw)
- is the Balance Line for the interim period, which was used for
plotting (13-period Smoothed Moving Average, moved into 8 bars into
the future);
The red line (Alligator's Teeth)
- is the Balance Line for a significant time
period is ten times lower (8-period Smoothed Moving Average, moved
by 5 bars into the future);
The green line (Alligator's Lips)
- is the Balance Line for a significant time period, which is lower
by one order of magnitude (5-period Smoothed Moving Average, moved
by 3 bars into the future).
All these lines are on average prices:
MEDIAN PRICE = (HIGH + LOW) / 2
With the Alligator can determine the direction of an existing trend
or its absence.
If all three lines are intertwined, the Alligator "asleep". At this
time, the market traded in a little price range (in the flat),
selecting the trader earned on past price movement. The longer
sleeping Alligator, the hungrier it becomes and the stronger will be
the subsequent price movement. While the Alligator is asleep, stay
square. Waking up, Alligator opens mouth (Balance lines diverge) and
starts to hunt for prey.
After eating, alligator back to sleep (Balance Lines
converge).
If the alligator is not sleeping, the
market is bullish or bearish trend (production runs from Alligator):
• 1. if the price is above the Alligator's mouth,
then the trend is upward;
• 2. if the price is below the Alligator's mouth, the trend is
downward.
Ichimoku Kinko Hyo
A very popular indicator created as based on
moving averages. Indicator Ishimoku create a Japanese analyst Hosoda
(alias Sanzhdin Ishimoku).
The indicator consists of five lines:
• Tenkan-sen
- the average price for the first time
interval (equal (high low) / 2, where the high and low - high and
low for the period);
• Kijun-sen
- the average price in the second period;
• Senkou Span A
/ Up Kumo
- midway between Tenkan-sen and Kijun-sen, shifted forward on value
of the second time interval;
• Senkou Span B
/ Down Kumo
- the average price for the third time interval shifted forwards by
the value of the second time interval;
• Chinkou Span
- the closing price of the current bar, shifted back on the amount
the second time interval.
Line Senkou Span A and Senkou Span B form a "cloud", which changes
color when the intersection of these lines.
If the price chart located above the cloud, then the trend is
upward. If the price chart below the cloud, then the market bearish
sentiment. If prices are in the "cloud", it says fletovom market.
Line motion Tenkan-sen sideways also talks about flat.
Key indicator signals:
Output prices from the cloud down to signal to sell up - on
purchase.
Often, coming out of the clouds, the price of
doing the path
approximately equal to the path up to the clouds.
The intersection of price and Chinkou Span (green line) is a signal to the transaction. If Chinkou Span crosses the price upwards, it is a buy signal, from top to bottom - for sale

If Tenkan-sen (red line) crosses Kijun-sen (blue line) from the top down, formed a sell signal, from the bottom up - by purchase
When trading in a "cloud" the price tends to the boundary of the clouds, to indicate Tenkan-sen (red line). If Tenkan-sen is directed downward, the price tends to cloud base if up - to the top
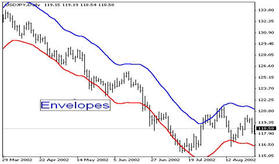
price channel upper - pcu
Or envelope
.
Two names for one indicator.
Because the market tends to speed up and slow down, draw
straight lines of support and resistance is quite difficult.
The indicator will build a flexible channel that responds to
changes in the rate of the market.
It is constructed on the basis of a simple moving average,
which moves up and down on a certain amount per cent, so
that most of the price fluctuation was within the lines.
Upper limit:
U = (1 + u / 100) x SMA (P, n);
Lower Bound:
L = (1 - d / 100) x SMA (P, n), where
U - upper band channel prices
L - lower band channel prices
u -% deviation from the average of the upper band,
d -% deviation from the average of the lower band,
SMA (P, n) - simple moving average.
If successful, the choice of parameters channel will
correspond to the equilibrium state of the market, and all
exits prices beyond it must be accompanied by the return of
her back.
About 5% of the price should be outside the lines, 95% -
within.
Convergence Divergence Moving Average (macd)
In the indicator is calculated and
constructed two lines:
MACDfast - fast line
SIGNAL - Signal (slow) line
Of the exponential average with a
smaller period (12) is subtracted exponential moving average
with a long period (26)
MACDfast = EMA (1912) [Price] - EMA (1926) [Price];
and the results are again smoothed using EMA to eliminate
random fluctuations:
SIGNAL = EMA (9) [MACDfast],
where Price - the price is usually Close.
Signals MACD:
• If
the MACD is below zero, the trend is downward, if the above
- is upward;
• The strongest signal for this indicator is the divergence
(Divergence). Divergence - a discrepancy in the direction of
the waves
graph and the corresponding waves
indicator. He warns of the imminent
reversal of the market;
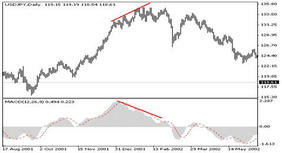
Signal bullish trend reversal or attenuation
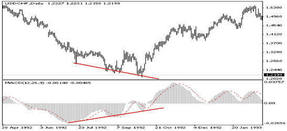
Turn signal bearish trend or its decay
• The intersection of the lines of the indicator
in the trend can be used as signals for open positions.
• If the MACD is below zero and there is no divergence, then the
suppression of the lines from the bottom up talking about correcting
upwards.
• If the MACD is above zero and there is no divergence, then the
suppression of the lines from top to bottom indicates downward
correction.
Average True Range (ATR) - a measure of the volatility of the market, developed and described by W. Wilder in his book "New Concepts in Technical Trading Systems."
True Range is the greatest of the following three values:
• the difference between the maximum and minimum of the current bar;
• the difference between the closing price the previous period and the maximum of the current bar;
• the difference between the closing price the previous period and the minimum price the current bar.
Indicator Average True Range (ATR) is a moving average of true range.
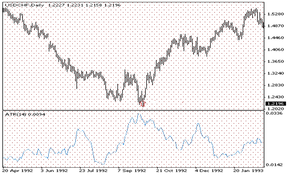
The basic rule
analysis of the oscillator:
The higher the indicator value, the
higher the probability trend change;
the lower the value, the weaker the trend.
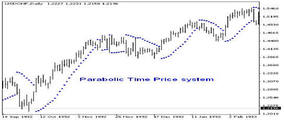
Parabolic (ptp)
Originally developed as an indicator
of automatic installation of Stop Loss (Stop Order) and a
coup position when the motion.
And she called Stop And
Reverse system - SAR. However, it turned out that the system
itself can be a good indicator.
In the indicator values are
calculated stops depending on the degree of progress in the
direction of the market trend. The greater the progress, the
closer the point indicator (stop loss) to the current value
prices.
SAR (i) = AF * (High (i-1) - SAR (i-1)) SAR (i-1) - when the
market rises;
SAR (i) = AF * (Low (i-1) - SAR (i-1)) SAR (i-1) - when the
market moves down;
where
SAR (i-1) - meaning parabolika on the
previous bar;
AF (Acceleration Factor) - the acceleration factor.
At the first bar, he is taken to be 0.02, and then
calculated as follows:
AF = 0,02 n * 0,02,
where n-number of new bars.
Parabolic signals:
Using the indicator is very simple and visual -
Direction of movement of the indicator coincides with the
direction of the trend.
Classical signal to open a position
- the intersection of the line graph line indicator.
Indicators of "directed change" (+ /-dm) the probable direction of (adx)
The indicator has two roles:
• 1. identifies
long-term trend of the market;
• 2. shows the power of the trend.
The indicator is constructed as two
mutually antithetical lines /-DM and lines ADX:
• 1. first goes in the
direction of price movement (line 1, DM);
• 2. second - in the
opposite direction (line 2,-DM);
• 3. third (ADX) is absolute (in absolute value) difference between
the lines /-DM, so the more lines of difference /-DM, the greater
the value of ADX.
Signals Indicator Average Directional Movement
Index (ADX):
• 1. intersection with the lines of extreme
or spread lines at the maximum-minimum;
• 2. intersection of the
lines DM and-DM is preceded by the appearance of a new trend or
enhance the current trends - a very strong signal;
• 3. If the line above the DM-DM, then the trend
- bullish, and vice versa;
• 4. if the lines diverge, the ADX rises, and the dynamics of the
trend increases, and vice versa;
• 5. If the ADX is less than 20, the trend is very weak.
Relative strenght index – rsi
This is one of the most popular implementations of
oscillators.
RSI = 100 - (100 / (1 U / D))
where
Un - the average of all UpClose period indicator calculation (n).
Dn - the average of all DownClose over the same period.
Basic signals for RSI:
• If the value is above 50, the upward trend in the market, if
lower, then descending;
• Divergence (divergence) between the direction of wave motion
graphics, and the indicator indicates the weakness of the current
trend and a possible reversal;
• In a flat market output indicator from the overbought (oversold)
is a signal to sell (purchase);
• In addition, it is one of the few indicators that are well suited
to graphical analysis tools: support and resistance lines, graphic
shapes.
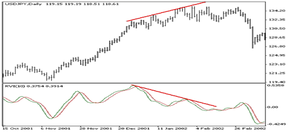
Relative vigor index, rvi
Calculation of the index of
relative vigor based on the idea that the upward market closing
price, usually higher than the opening price. And in a bear market
closing prices are usually lower opening prices.
To normalize the index change in price divided by the maximum range
of prices for a bar:
RVI = (CLOSE - OPEN) / (HIGH - LOW)
Where:
OPEN - open price;
HIGH - the highest price;
LOW - the lowest price;
CLOSE - the closing price.
To eliminate the random fluctuations in price oscillator smoothed
simple moving average with period 10. We also construct a signal
line, 4-period symmetrically weighted moving average of the
indicator.
Key signals Relative
Vigor Index:
• Bullish
divergence / bearish convergence - the main signal, indicating the
weakness of the current trend;
• a good moment to open a position on the sale (purchase) will be
crossing the line RVI signal line downwards (upwards) after the
appearance of the chart bullish divergence / bearish convergence;
• In a flat market exit from the overbought (oversold)-signal to
sell (buy).
Standard deviation
Measures the volatility of the market. This
indicator describes the size of price fluctuations relative to the
moving average. For example, if the indicator value is large, the
market is volatile and the price bars are rather scattered with
respect to moving average. If the indicator value is low, the market
is characterized by low volatility and the price bars are close
enough to the moving average.
Normally, this indicator is used as a component of other indicators.
Thus, when calculating Bollinger Bands of the standard deviation of
the tool is added to its moving average.
Calculation
StdDev (i) = SQRT (AMOUNT (j = i - N, i) / N)
AMOUNT (j = i - N, i) = SUM ((ApPRICE (j) - MA (ApPRICE (i), N, i))
^ 2)
where:
StdDev (i) - Standard Deviation of the
current bar;
SQRT - square root;
AMOUNT (j = i - N, i) - sum of the squares
of the j = i - N to i;
N - smoothing period;
ApPRICE (j) - applied price of the j-th bar;
MA (ApPRICE (i), N, i) - any Moving Average
of the current bar for N period;
ApPRICE (i) - applied price of the current bar.
The dynamics of the market consists of the
successive alternation of periods of rest and activity bursts, so
the approach to this indicator is simple:
• If the indicator value is too small, then there is a market in
complete peace, it makes sense to expect a quick burst of activity;
• Conversely, if the indicator is extremely high, therefore, likely
that activity will soon start declining
The index
of trade channel
Indicator rasschityvetsya in several stages.
1) Calculate the so-called typical price
TP = (High + Low + Close) / 3
2) Further, the TP value is subtracted simple moving average
calculated from the values of TP
D = TP - SMA (TP, n)
3) The value
of a simple moving average calculated from the values of D is
multiplied by 0.015
M = SMA (D. n) * 0,015
4) The final value of the indicator
CCI = M / D
Basic signals for CCI:
• Divergence (divergence) between the
direction of wave motion graphics, and the indicator indicates the
possibility of corrective movements;
• In a flat market output indicator from the overbought (oversold)
is a signal to sell (purchase).
Stochastic
line
The purpose of Stochastics - identifying price trends and cornering
by monitoring the placement of the closing prices in the last series
of peaks and bottoms.
The method of
monitoring the following fact: when prices rise, their daily closing
levels tend to be closer to the value of the maximum.
If prices continue to rise, and the daily closing prices
begin to fall, it signals the willingness of trend turn.
When prices fall, all the same only for the minima.
There are three stochastic lines:% K,% D,% R.
They reflect the location of the current closing
price relative to the selected time period.
% K = 100 ((C - Ln) / (Hn - Ln))
where
C - current closing price
Ln - lowest Low over the last n bars chart
Hn - is the highest High over the last n bars.
% D = SMA (% D, n1)
n1 - the value of a simple moving average.
Basic signals for Stochastic:
• Initially, the indicator was created to trade in the market in a
state of a flat market. But now the trend movement using divergence
(divergence) between the direction of wave motion graphics and
display as a signal of a possible reversal or correction;
• In a flat market output indicator from the overbought (oversold)
is a signal to sell (purchase);
• If the faster% K line crosses the slower% D up,
it's a buy signal. If the faster% K line
crosses the slower% D down, this is a signal to sell.
Concluding remarks
When working on a strong trend to treat oscillator signals with the
utmost care, while false signals oscillators tend to talk about
strengthening trend.
If the trend is upward, then most of the time oscillators are
overbought, if the opposite is in oversold territory
Performance
measures
Basic rules:
• Lower the volume - reduction of interest in the dynamics of the
course or change in trend or a temporary stabilization of prices.
• Increased volume - increasing interest in the dynamics of the
course, or reinforce existing dynamics, or the emergence of a new
direction of price change.
• Sometimes a gradual decline in prices accompanied by drastic
changes.
• Peak volume signals a possible trend reversal.
Indicator of the equilibrium volume (On Balance Volume - OBV)
1) If C (i)> C (i - 1),
OBV (i) = OBV (i-1) + Volume (i)
2) If C (i) <C (i -
1),
OBV (i) = OBV (i-1) - Volume (i)
where
C (i) - Current Close;
C (i - 1) - Close the previous bar;
Volume (i) - tekschee value of trading volume.
Accumulation / distribution (a
/ d)
A / D = SUM
(((Close - Low) - (High - Close)) * Volume / (High - Low), N)
This indicator is the complicated version of the indicator OBV, so
the method works with exactly the same.
Major signals for
the A / D:
• If each new
peak price confirmed by a new peak indicator, then this confirms the
force of a bull (rising) trend;
• If each new trough price confirmed a new indicator of depression,
then this confirms the force of a bear (downward) trend;
• Divergence (divergence) between the direction
of wave motion graphics, and the indicator indicates the weakness of
the current trend and a possible reversal;
• Break the trend line, built on the indicator warns of imminent
breakdown of the trend line on a chart.
• The main signals for Force Index:
• The main signal - Divergence (divergence) between the direction of
wave motion graphics and display. Indicates the possibility of a
reversal of the market.
Index of cash flow ( mfi)
The indicator is calculated in several steps.
1) Calculate
the so-called typical price:
TP = (High + Low + Close) / 3
2) If C> C (-1), the calculated + MF = TP * Volume
If C <(-1), then calculated - MF = TP * Volume
On this basis, calculated a positive cash flow (Positive Money
Flow):
PMF =? (+ MF) - the sum of all + MF for n-bars.
And negative cash flow (Negative Money Flow):
PMF =? (-MF) - the sum of all-MF for n-bars.
3) Next, calculate the ratio of cash (Money Ratio):
MR = PMF / PMF
4). And the final value of the indicator (Money Flow Index):
MFI = 100 - (100 / (1 + MR)
where
C - Current Close;
C (-1) - Close the previous bar;
Volume - the value of trading volume for the current bar.
Major signals for the MFI:
• If each new
peak price confirmed by a new peak indicator, then this confirms the
force of a bull (rising) trend;
• If each new trough price confirmed a new indicator of depression,
then this confirms the force of a bear (downward) trend;
• Divergence (divergence) between the direction
of wave motion graphics, and the indicator indicates the weakness of
the current trend and a possible reversal.
Index to facilitate the market
( bw mfi)
The indicator is calculated by the formula:
BW MFI = (HIGH - LOW) / VOLUME
Where:
HIGH - the
highest price of the current bar; LOW - the lowest price of the
current bar; VOLUME - the volume of the current bar.
Signals:
• Simultaneous
growth of BW MFI and volume (Volume) says that more and more players
enter the market (increasing volume), and new players take positions
in the direction of the bar.
• The simultaneous drop in BW MFI and volume of talk about reducing
the interest of participants to the dynamics of the price.
• BW MFI rose, and the volume down - the market does not support
such a dynamic price. Price Change - the result
of speculation.
BW MFI fell, and the volume increased - a
fierce battle between bulls and bears (the amount raised), but the
forces are roughly equal (the indicator has fallen). This bar B.
Williams "curtsying. Typically, a breakthrough of such a bar is very
important in terms of future price movement.