Support and Resistance
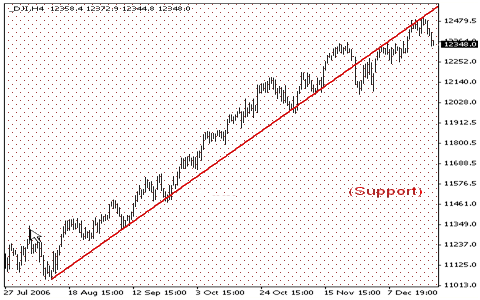
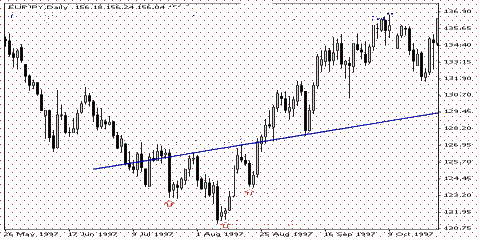
If you look at charts of price movements, it often can be seen that the peaks and troughs of the market are built practically on the same slope (and sometimes horizontal) lines. Such lines are called support and resistance lines.
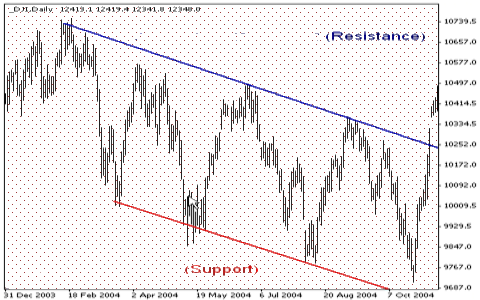
Line resistance (Resistance): lines that carry on significant market tops. Number of times greater than their market peaks confirms the line, the more "powerful" it becomes. That is, the market shows that the level of prices, marked the line of resistance is very important and the market and reaching "saturation" is repelled from it.Line support : These lines are built the same lines of resistance, but are on the troughs of the market.
At a penetration down the support line it turns into resistance. At a penetration up line of resistance, she turns into support.Channel line
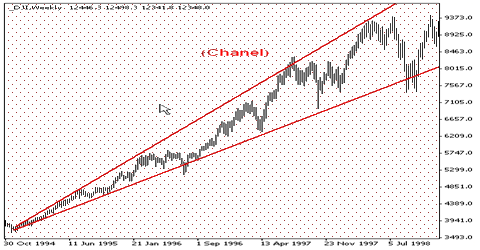
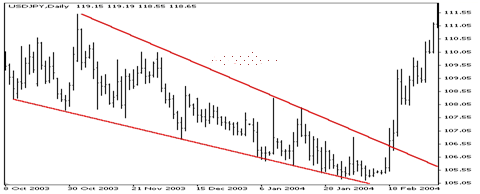
Quite often, prices range between support and resistance lines. Then a movement known as channels (Chanel). If the channel lines diverge, it is a divergent channel, if you agree, then converging.Graphic reversal
On the charts price movements from time to time produced some of the formation, after the appearance of which, the market in most (but not 100%) of cases are in a certain direction. Such formations are called figures or graphics model.
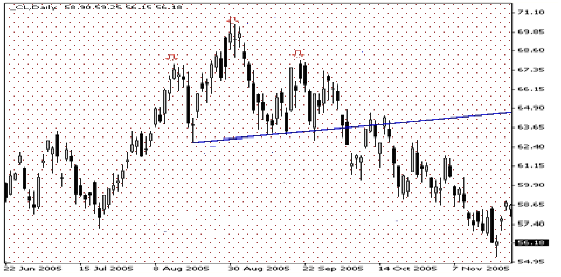
Head and Shoulders (Head & Shoulders)
This model, after the formation of which the market moves in the opposite direction.
The key point in determining this figure is the neckline. This line is constructed from the hollows at the base of the head. Just break through the schedule of this line after the formation of the second arm said that in front of us head and shoulders.
This model has a very useful feature for the trader. The fact that the largest pieces you can determine an approximate (minimum) market movement in the opposite direction. That is, determine the purpose of (Target) market movement. The purpose is defined as the height of the head from the neckline, delayed from the point of penetration in the opposite direction.
As a confirmation of certain figures head and shoulders using the volumes of trades.
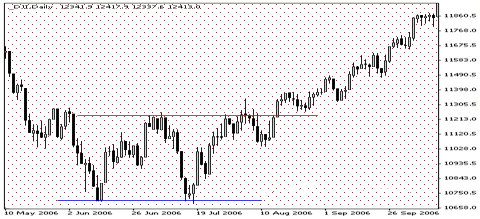
Double (triple) top / bottom (Double top / bottom)
This is just the reversal figure. However, it belongs to an unreliable market signals, since it gives many false alarms. For screening used Divergence on the oscillator and the testimony of the volume.
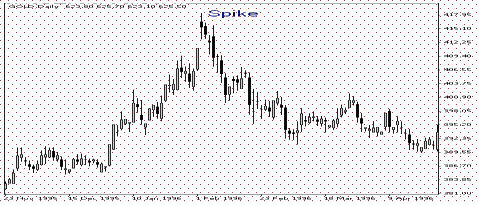
V-shaped top and bottom ("spike" or Spike)
The model is formed, usually after rapid previous trends. On the chart a lot of gaps, there are practically no levels of resistance / support. Reversal is produced as a key item or a fracture of the island. The only signal for the trader can serve as a breakthrough very steep trend line.
Figures confirm the continuation of the trend
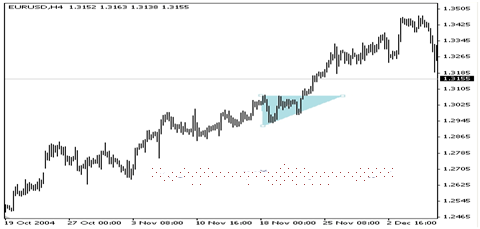
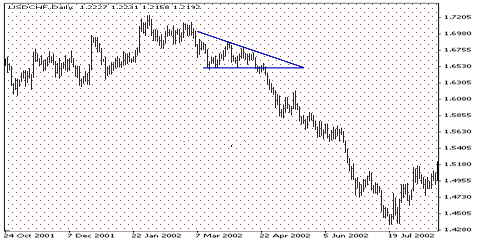
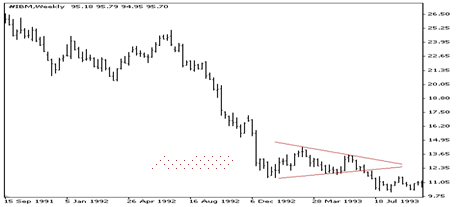
Triangle (triangle)
General rules of analysis of triangles:
• in a classic triangle should be five lines from the entrance to the triangle (three down and two up, or vice versa)
• if the price is above, then a strong position to continue the price down
• if the price is lower, the stronger position to continue the upward price
• if the angle of the triangle pointing up, the price will go up soon
• if the angle of the triangle is pointing down, the price will go down soon
• The more lines in a triangle and closer to the top out of it, the stronger and more significant will be the price dynamics in output, but if the output happens in the last quarter, the subsequent motion is likely to be sluggish and unstable
• breakthrough occurs, most likely between 1 / 2 and 3 / 4
• vertex of the triangle will be in the future serve the level of support - resistance
• The amount decreases as the formation of a triangle, increasing sharply after the break
• after a breakthrough price will be in the direction of the breakout, as a minimum distance equal to the height of the triangle to the greatest part
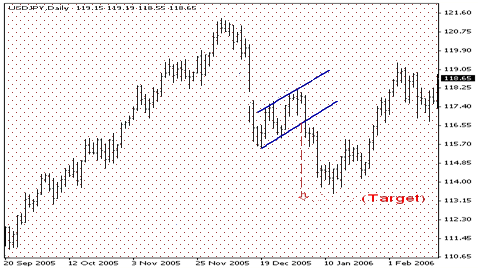
Flag (Flag)
The figure consists of two parts. Shaft - ideally formed by one or two big bars. Cloth - formed as a remedial undulating motion. If at the tops and bottoms of the correction to the line resistance and support, you get really very similar to the flag. The breaking of the cloth is usually in naprivlenii previous trends. Goal - the flagpole height, delayed from the point of penetration.Pennant
This is a special case of shape flag. Only as a piece of cloth in it stands a symmetrical triangle.Wedge
The figure is similar to the triangle. The difference is that the line bounding the figure in the same direction but at different angles. The figure is often formed on the corrective movements and breakthrough occurs in the opposite direction of the slope of the figure, ie, toward the main trend. In the case of education shapes against the trend, the penetration may indicate a trend reversal.
Rectangle
The rectangle is very similar to a triple top. To determine the species formed shapes using oscillator analysis and analysis pomoschbyu volume measures. After breaking the price will be in the direction of the penetration distance not less than the height of the rectangle. Edge of the rectangle in the future will be good levels of resistance - support.
| Welcome Guest | RSS | Friday 19.06.2026, 10:04 | ||
| Forex Basic Information |
|
|